
Upsampling Algorithms, Precision and Noise Shaping.
Reconstruction accuracy in the context of upsampling refers to how well the upsampled signal approximates the original (analog) signal. It is a measure of how closely the interpolation process used during upsampling preserves the characteristics and fidelity of the original audio signal. This is crucial for maintaining audio quality and avoiding artifacts.
Reconstruction accuracy depends on the quality of upsampling algorithm and/or filters used, the precision of the calculations, and the application of noise shaping. The choice of upsampling algorithm is critical as it determines how the new samples are generated. The precision of the calculations affects the accuracy of the interpolation process, with higher precision leading to more accurate reconstruction. Noise shaping is used to reduce quantization noise, which can introduce artifacts in the upsampled signal. By shaping the noise, quantization noise it is moved to frequencies where it is less audible, preserving the accuracy of the signal and improving the overall audio quality.
Note: Even though typical recorded music is limited in precision to a maximum of 32bits, it is still beneficial to use higher precision for the upsampling process. This is because:
- The upsampling process involves multiple calculations and the use of higher precision helps to reduce the accumulation of errors and maintain the accuracy of the reconstructed signal.
- During the upsampling process, the intermediate samples that are added can have a much higher precision than the original samples and are critical to the perceived quality of the reconstructed signal.
Evaluating Reconstruction Accuracy.
In order to evaluate the reconstruction accuracy of an upsampling algorithm, we need to compare the upsampled signal with the original signal sampled at the same rate as the upsampled signal. It is easier to do this comparison with simulated signals as we do not have access to recorded music signals at different rates in a controlled setting. For the purpose of demonstration, we can use band-limited signals that are generated at a lower rate (1fS: 44.1kHz) and upsampled to a higher rate. The upsampled signal can then be compared with the same band-limited signal generated at a higher rate (16dfS: 705.6kHz) to evaluate the accuracy of the upsampling algorithm.
For the purpose of this demonstration, we chose a Band-Limited 44Hz Saw-Tooth (BLST) signal generated at 44.1kHz and upsampled it to 705.6kHz using various algorithms including PGGB. We chose BLST as it is harmonic rich with harmonics stopping just short of the Nyquist frequency (22.05kHz), it also has very steep rising edge and a slow decay. Below is the time domain and frequency response of BLST signal we used.
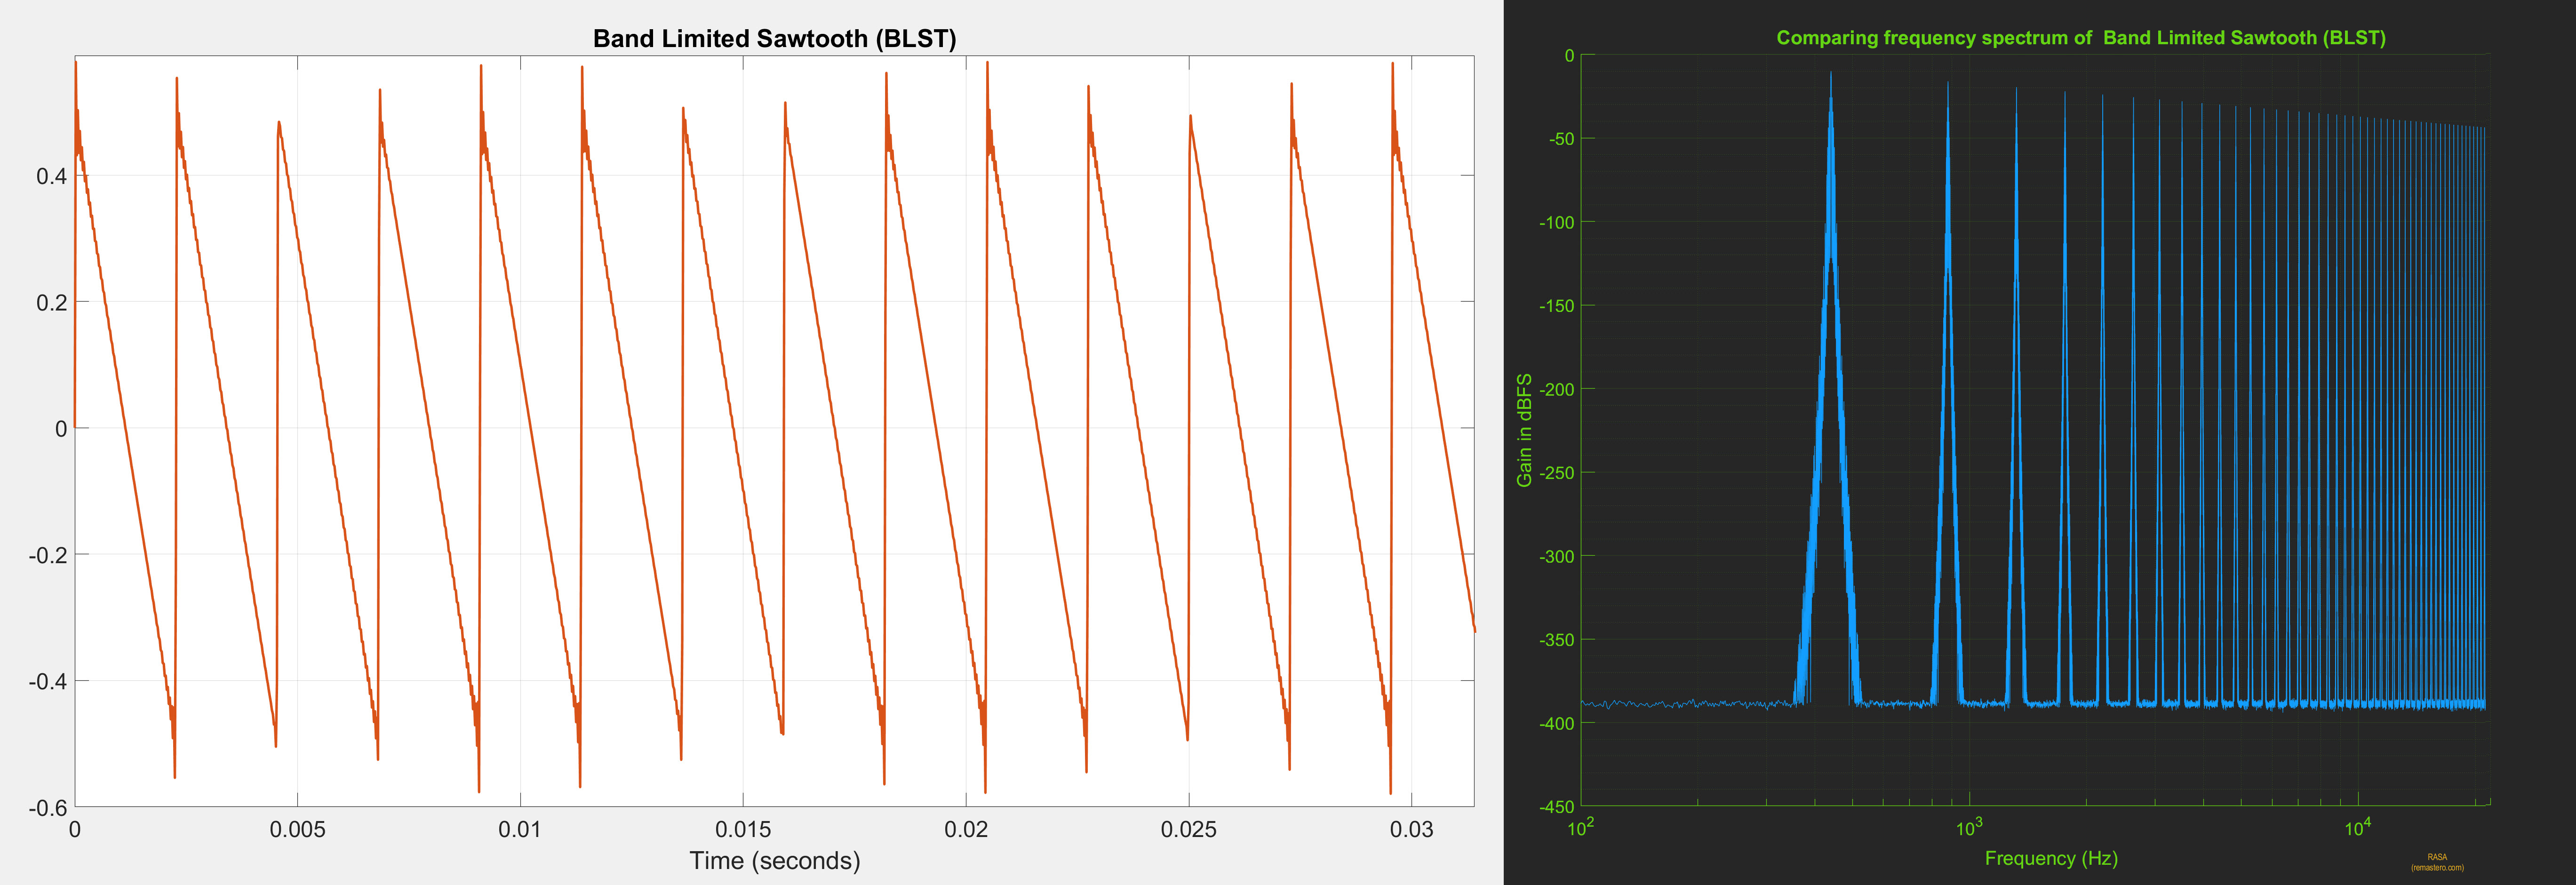
Note: BLST is a stationary, periodic signal and unlike much more complex music signals. It is a good test signal to objectively establish the base line for reconstruction accuracy. If an upsampling algorithm cannot accurately reconstruct BLST, it is even less likely to accurately reconstruct more complex signals.
Comparing Algorithms.
Using the 44.1kHz sawtooth signal as input we can now compare the reconstruction accuracy of upsampling algorithms at different precisions. We will look at time domain plots, frequency spectrum of the upsampled signals and also spectrum of the error (i.e., the difference between the reference signal and upsampled signal).
For perfect reconstruction, the upsampled signal should be identical to the reference signal both in time and frequency domain. The error spectrum should be flat and close to the quantization noise floor.
-
PGGB.
PGGB is non-apodizing, with a near ideal transition band and very high attenuation. It uses all the information in the signal and is designed to provide near ideal reconstruction of the original signal. Below are the results of upsampling the BLST signal to 705.6kHz using PGGB at 107 bit precision. The time domain and frequency spectrum of the upsampled signal are shown below.
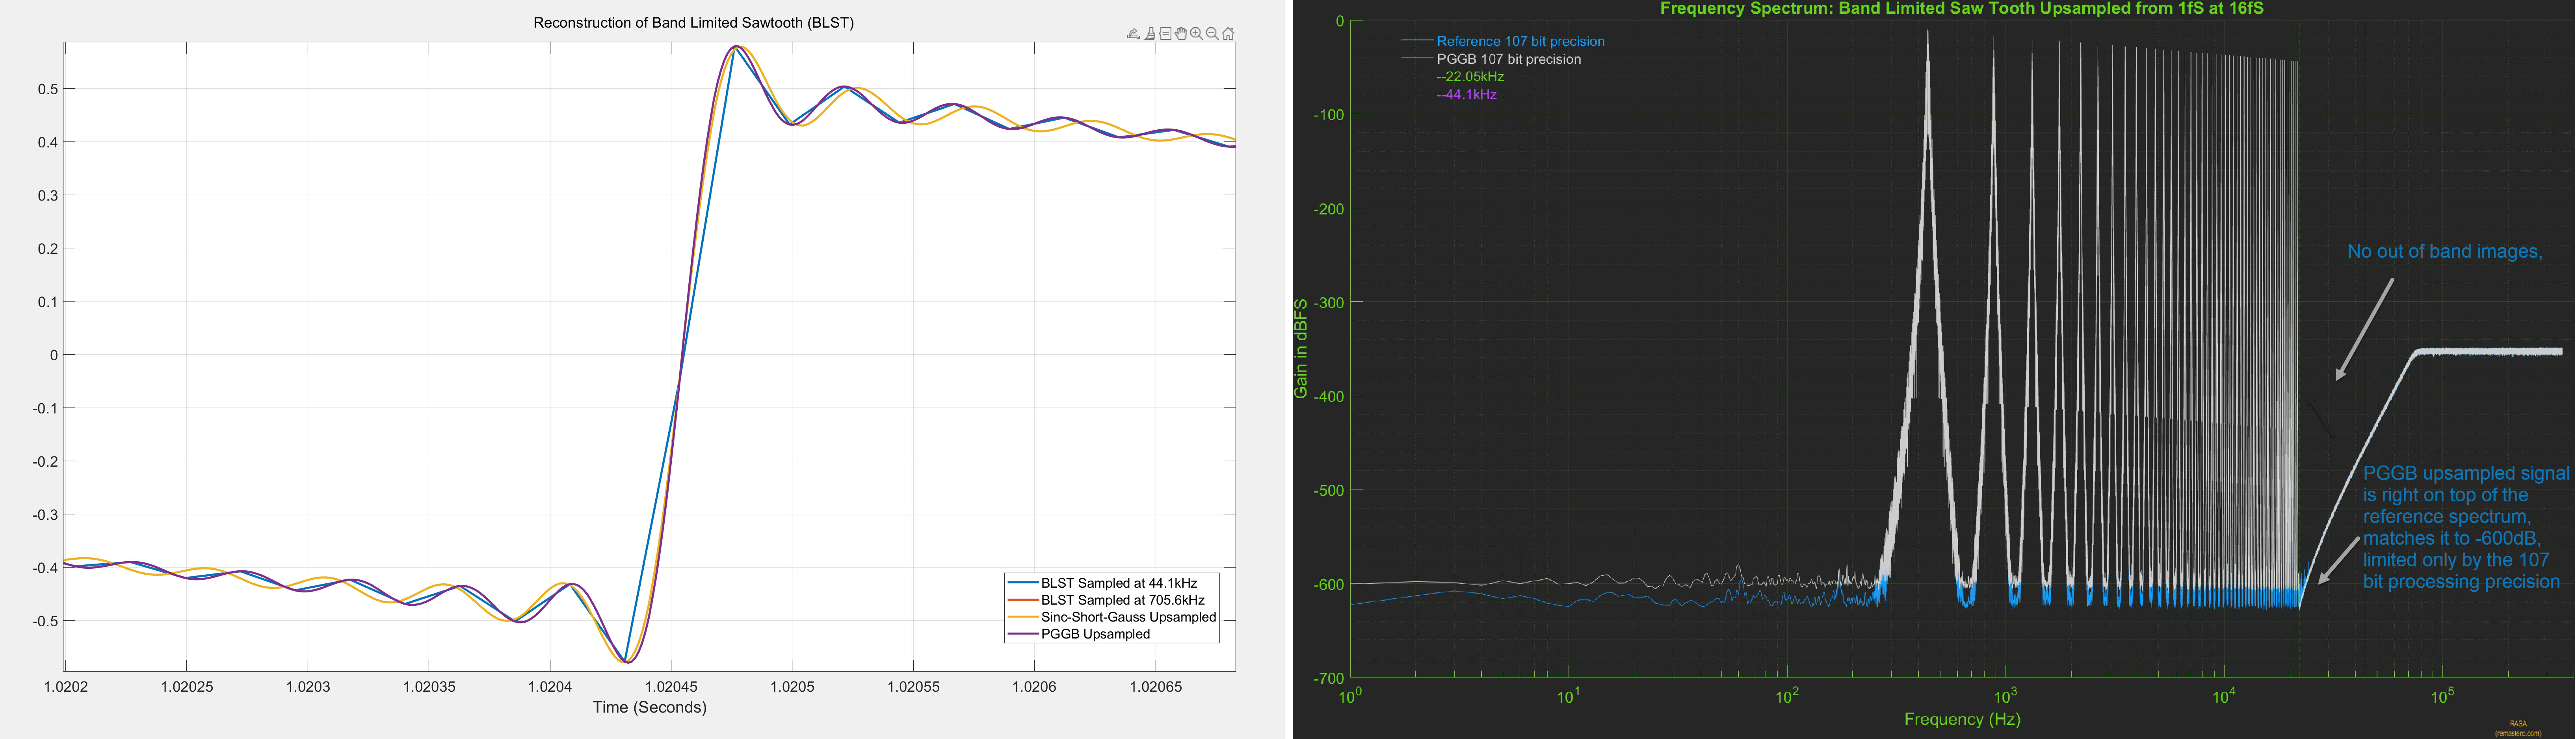
The reference signal was directly generated at 107 bit precision at 705.6kHz. The plot on the left is the time domain plot, zoomed into one of the rising edges of the sawtooth signal. The PGGB upsampled signal (purple) is right on top of the reference signal (red) and is indistinguishable. The plot on the right is the frequency spectrum of the PGGB upsampled signal (grey) and the reference signal (blue). Here too, PGGB is right on top of the reference signal and matches it up to -600dB!. We see the same behavior for all precisions (64 bits to 256 bits), irrespective of the precision used, the PGGB upsampled signal matches the reference signal, limited only by the noise floor of the precision used.
Because the PGGB upsampled signal is right on top of the reference signal both in time and frequency domain, it is hard to tell if there is any difference. It is easier to illustrate reconstruction accuracy by plotting the spectrum of error between the reference signal and PGGB upsampled signal. Below is the plot of the spectrum of the error at all precisions. It clearly shows there are no errors in-band (which includes the audible range). There are no out of band errors either, because all the high frequency images are fully attenuated. What is seen is close to a flat line corresponding to the quantization noise floor for the precision used.
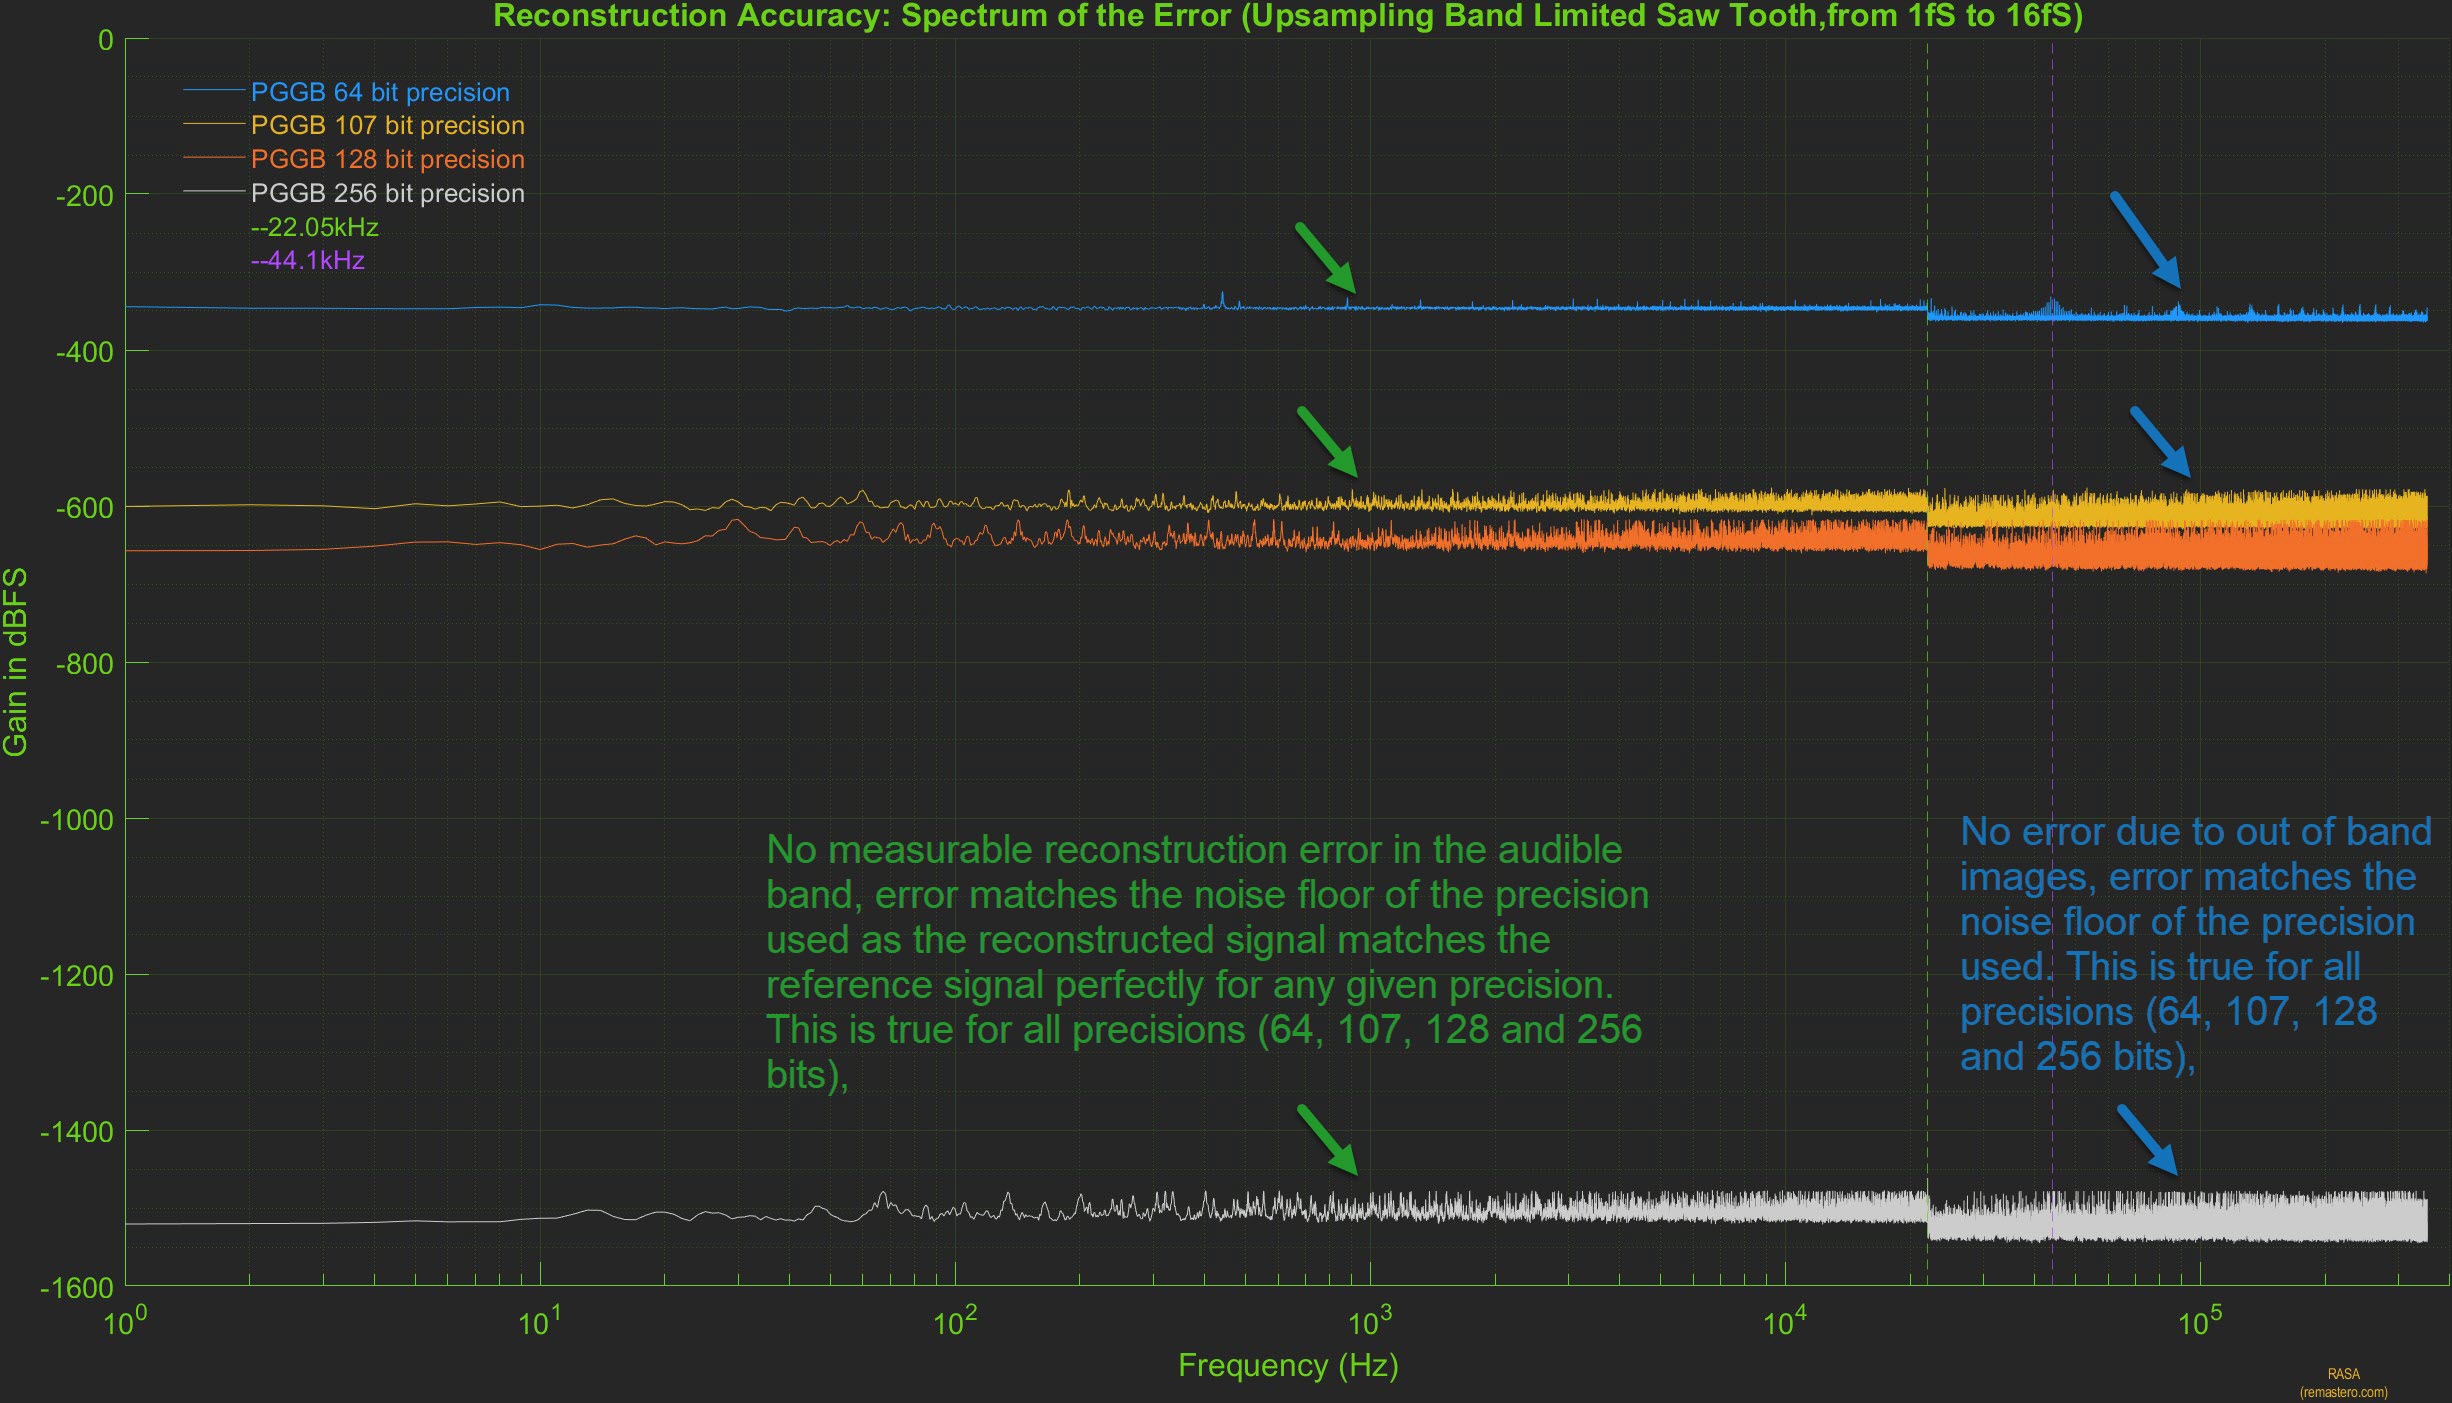
Form the above plots, we clearly see that in the case of PGGB, the reconstruction accuracy is limited only by the quantization noise floor. This is where Noise Shaping plays a big role. If a simple 24 bit or 32 bit dither were to be used, then the reconstruction accuracy will be limited to -200dB or higher and using higher precision would be counter productive.
-
Short Apodizing Filter (4k Gaussian Windowed Sinc).
Short apodizing filters are designed to have a short impulse response and roll-off close to or slightly earlier than 20kHz with the intent to remove any aliasing artifacts already present in the signal. For this analysis, we chose a linear phase sinc filter with 4065 taps and a corner frequency of 20.5kHz, and used an Approximate Confined Gaussian window (ACGW) with alpha = 0.065. Below are the results of upsampling the BLST signal to 705.6kHz using the short apodizing filter using 107 bit precision. The time domain response of the upsampled signal are shown below.
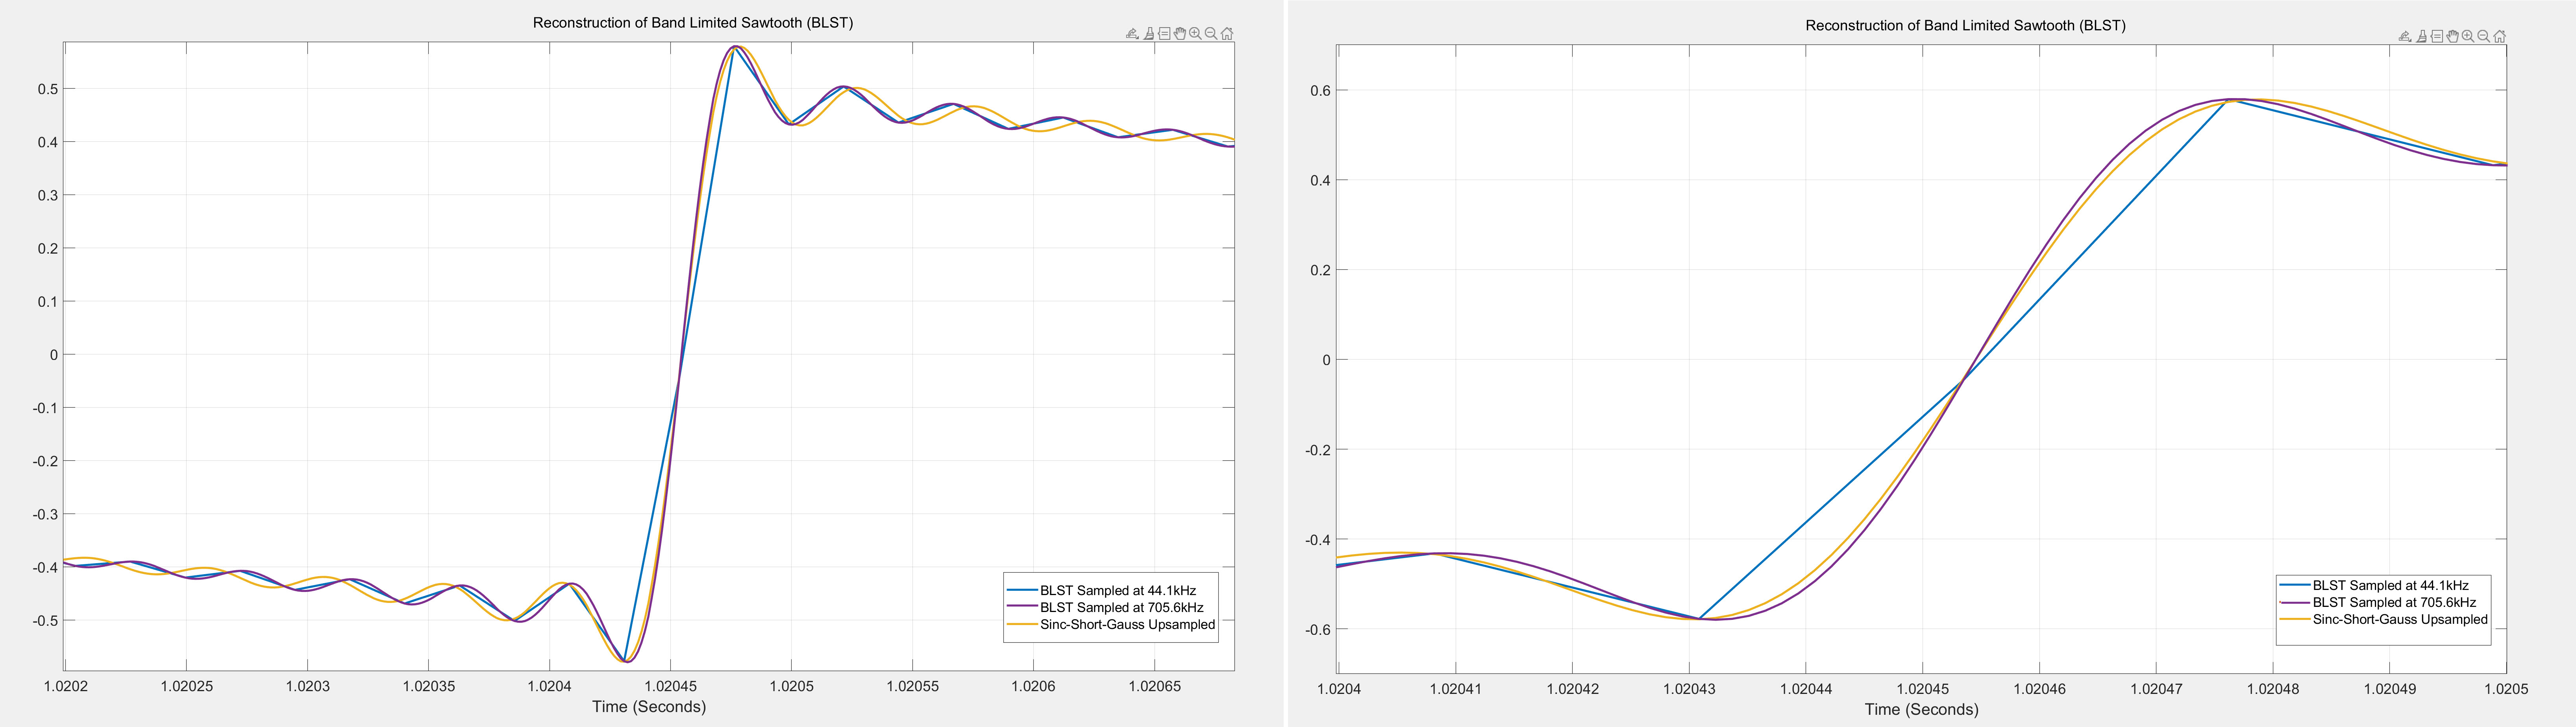
The reference signal was directly generated at 107 bit precision at 705.6kHz. The plot on the left is the time domain plot, zoomed into one of the rising edges of the sawtooth signal. The short apodizing filter upsampled signal (yellow) does not match reference signal (purple) and is clearly distinguishable. The plot on the right is further zoomed to show the rising edge and it is very clear that the upsampled signal (yellow) is slower (with a slightly less steep slope) compared to the reference signal (purple). This behavior should not be surprising given the apodizing nature of the filter attenuates the higher order harmonics present in the signal. This attenuation will be further evident in the frequency spectrum of the upsampled signal
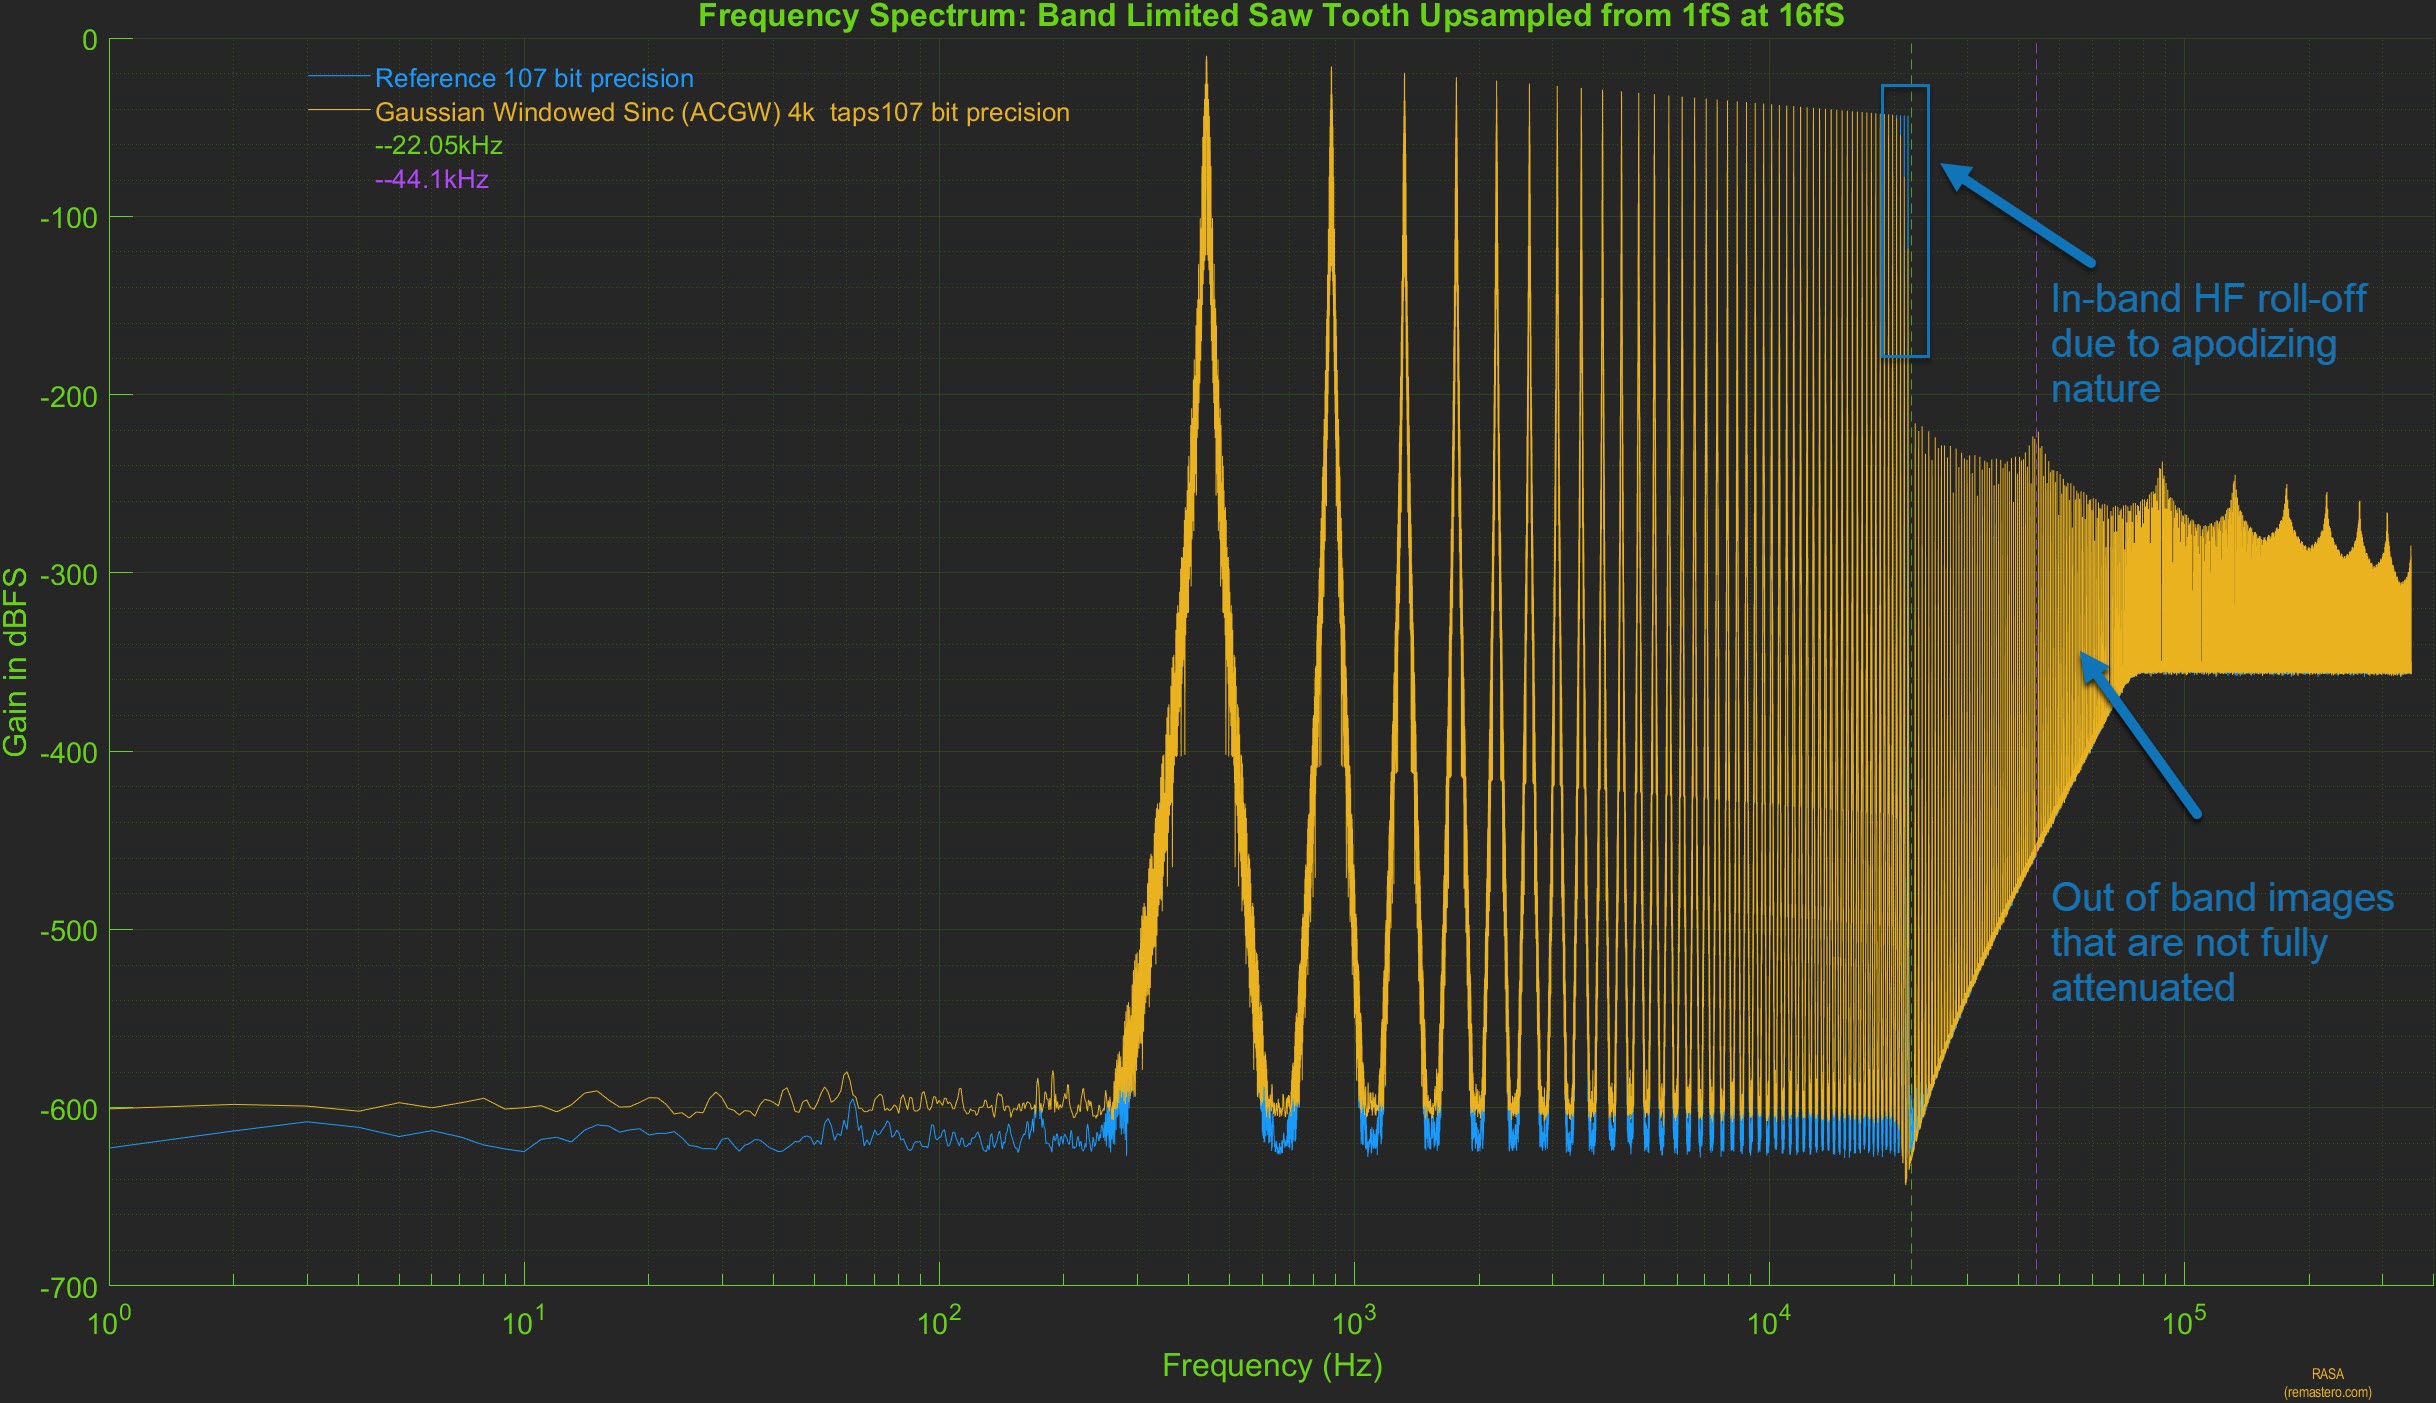
In the plot above, the frequency spectrum of the upsampled signal using the short apodizing filter (yellow) is shown. Compared to the spectrum of the reference signal (blue), the in-band high frequency roll off can be seen starting close to 20khz, thus attenuating the higher harmonics present in the original signal. The out of band high frequency images are not fully attenuated either and this too is evident after the Nyquist frequency of 22.05kHz. However, in the audible range, it is very hard to tell them apart as the spectrum of the upsampled signal is right on top of the reference signal.
Here too, it is easier to evaluate the reconstruction accuracy by plotting the spectrum of error between the reference signal and short apodizing filter upsampled signal. Below is the plot of the spectrum of the error at all precisions (on the left). It clearly shows there are three types of error present. Error in the audible range, error due to high frequency roll-off due to apodizing nature of the filter and error in the out of band range as the HF images are not fully attenuated. These errors are due to a combination of factors such as the length of the filter, the window used and the corner frequency of the apodizing filter.
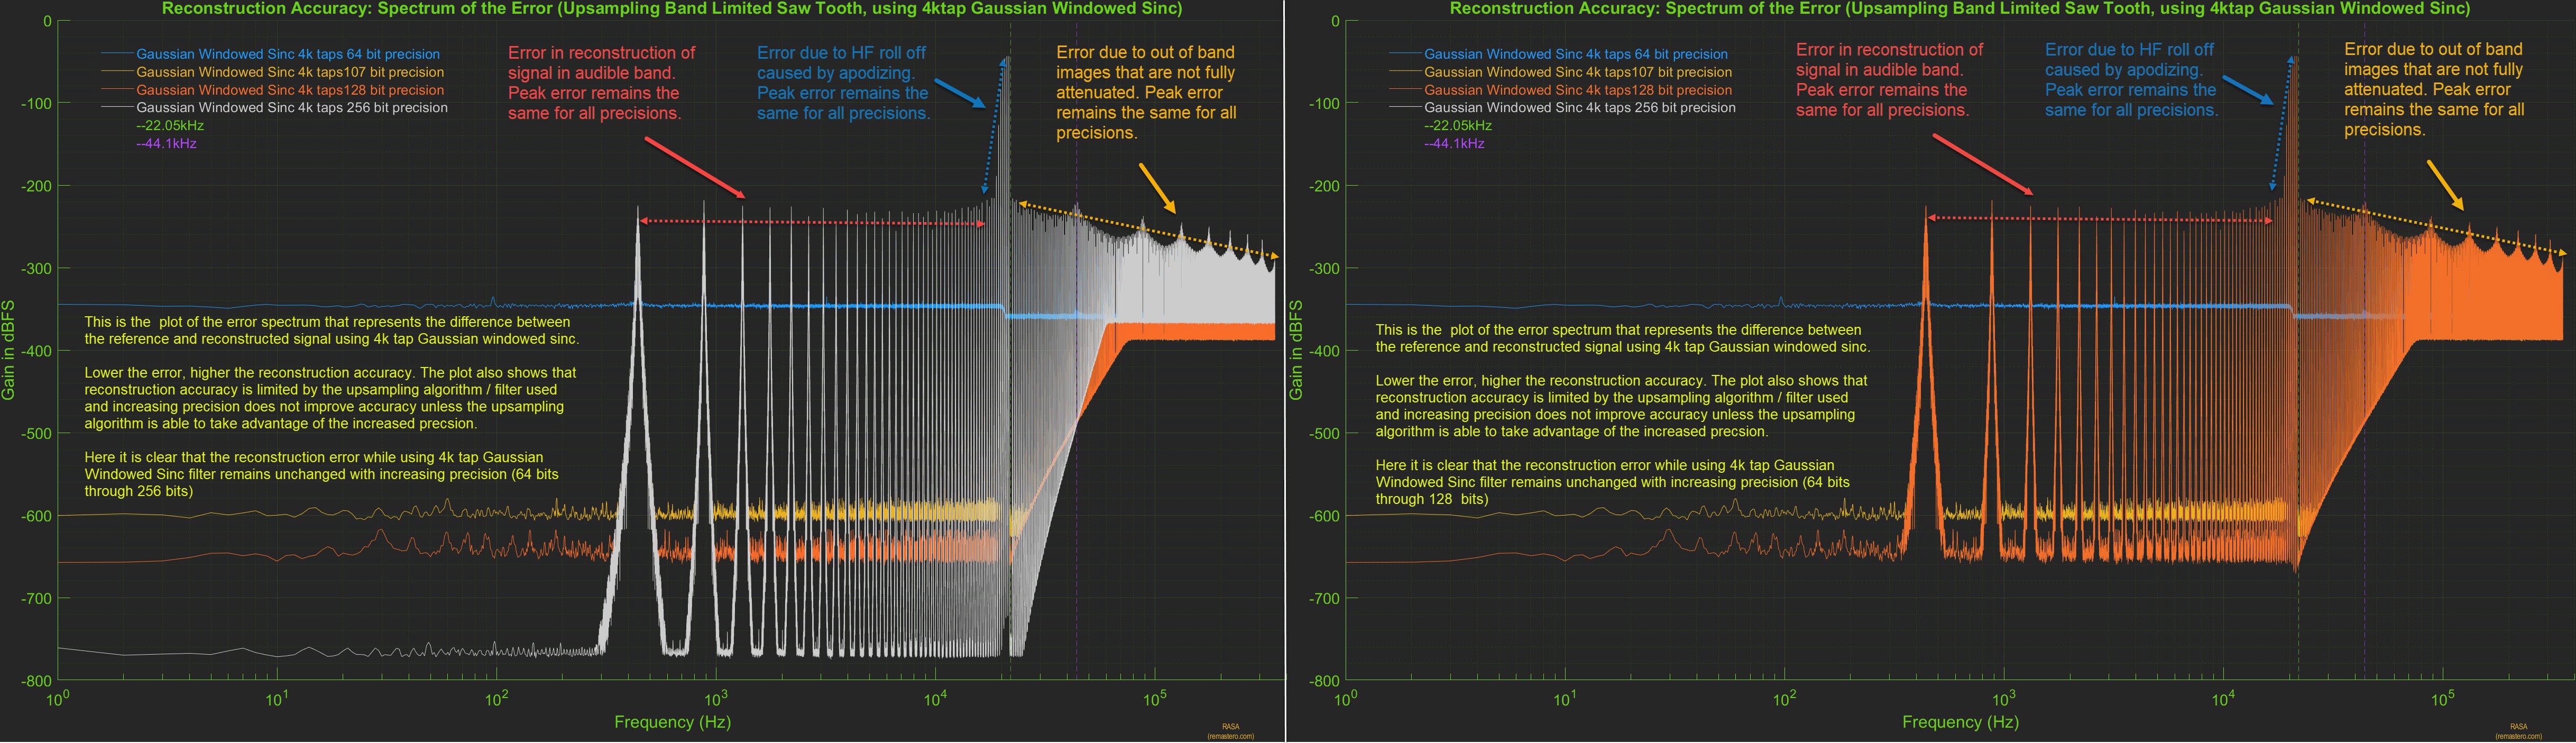
From the above plots, we clearly see that in the case of short apodizing filter, the reconstruction accuracy is limited by the filter design. The reconstruction error remains unchanged with precision, increasing precision reduces the quantization noise floor but the peak error remains unchanged. In the plot on the right, we have removed the error spectrum for 256 bit precision to reveal the error at 128 bit precision. When the upsampling algorithm used is not accurate, it is counter productive to increase the precision and 64 bit precision would suffice for this filter.
Objectively, it is easy to see that this is a far-cry from the near ideal reconstruction seen with PGGB. next, let us see if some of these issues can be remedied by using a long sinc based filter that is non-apodizing
-
Long Non-Apodizing Filter (2M Flat-top Windowed Sinc).
For this next analysis, we chose a long linear phase sinc filter with 2 million taps, it is non apodizing with a corner frequency that matches the Nyquist frequency of 22.05khz, and used the HFT248D Flat Top window that provides 248db of side lobe attenuation. We chose this filter to illustrate 1. if increasing the number of sinc coefficients can improve the reconstruction accuracy, 2. if the combination of longer filter and the flat top window provides better suppression of out of band HF images and 3. to avoid any intentional attenuation of in band high frequency signals. Below are the results of upsampling the BLST signal to 705.6kHz using the long non-apodizing filter using 107 bit precision. The time domain and frequency spectrum of the upsampled signal are shown below.
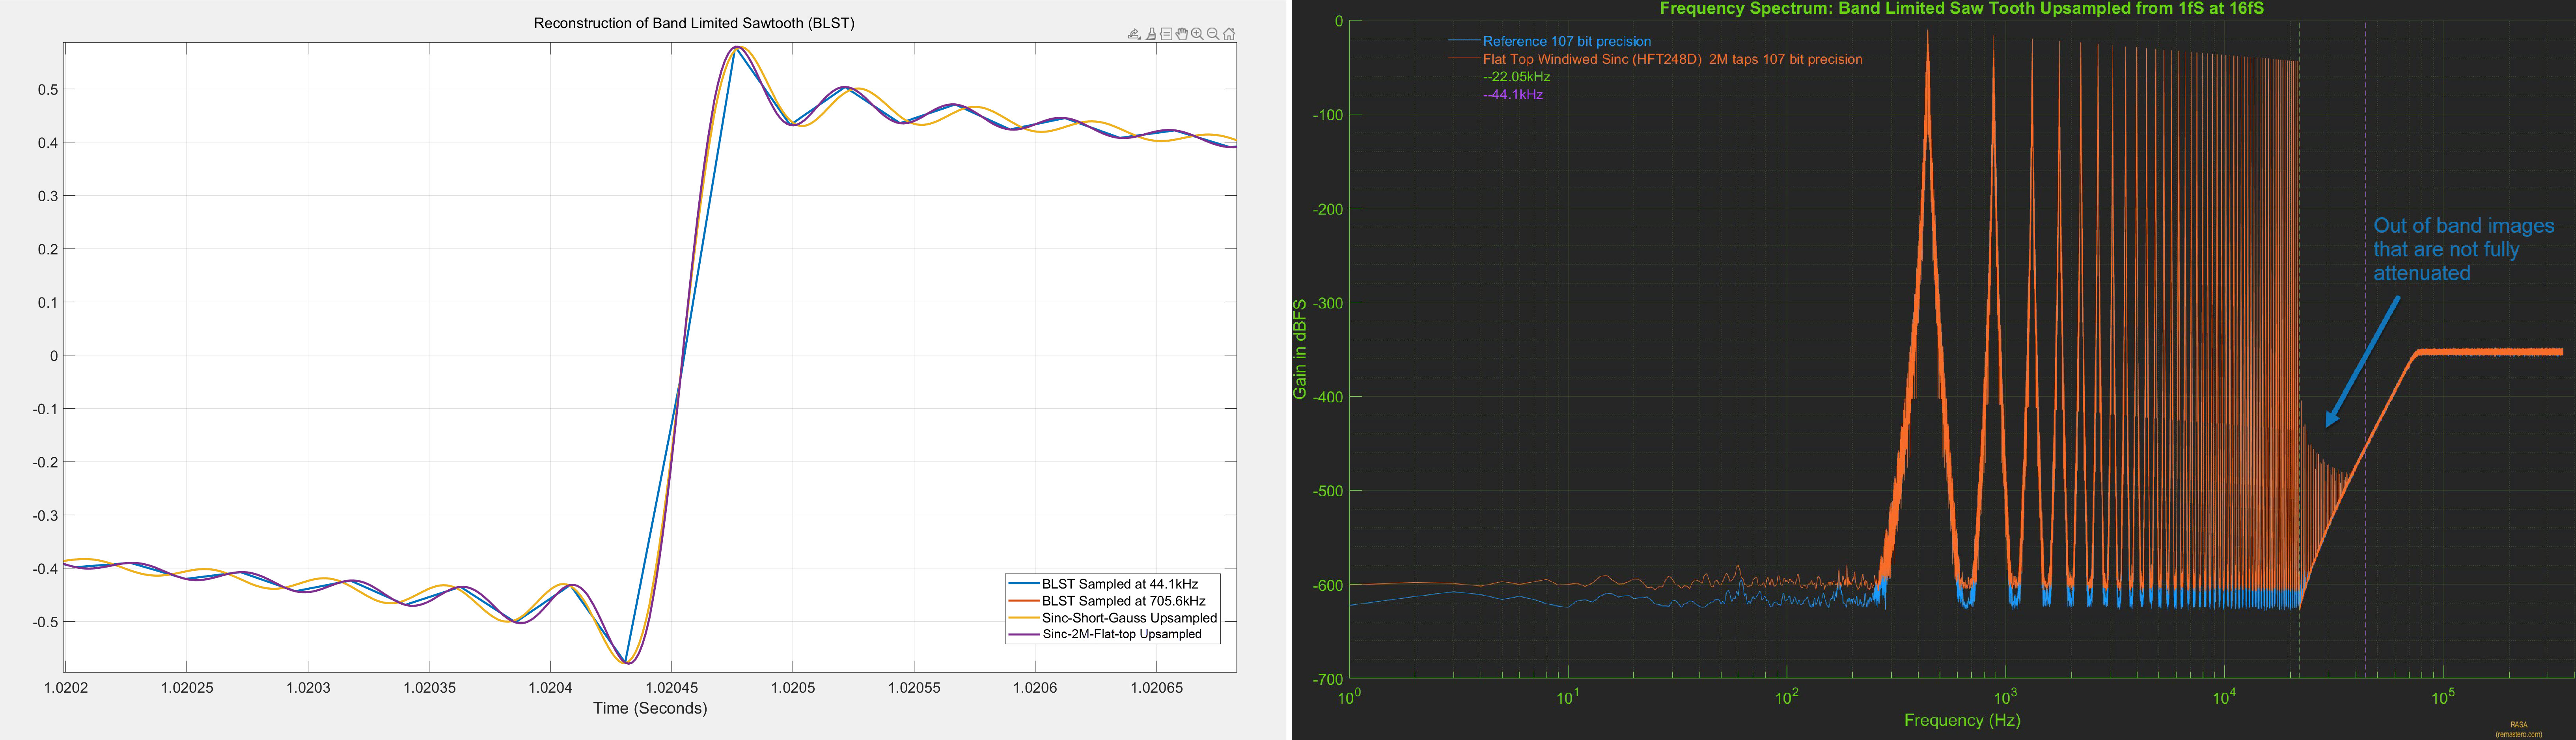
As before, the reference signal was directly generated at 107 bit precision at 705.6kHz. The plot on the left is the time domain plot, zoomed into one of the rising edges of the sawtooth signal. The 2M Sinc upsampled signal (purple) is right on top of the reference signal (red) and is indistinguishable. The plot on the right is the frequency spectrum of the 2M sinc upsampled signal (orange) and the reference signal (blue). Here the spectrum of 2M sinc upsampled signal is right on top of the reference signal until the Nyquist frequency of 22.05khz, but unlike PGGB upsampling, we still see out of band images that are not fully attenuated.
We further evaluate the reconstruction accuracy of the 2M sinc filter by plotting the spectrum of error between the reference signal and 2M sinc filter upsampled signal. Below is the plot of the spectrum of the error at all precisions. It clearly shows there are two types of error present. Error in the audible range, error in the out of band range as the HF images are not fully attenuated. While the longer filter and the flat-top window helped in decreasing both in-band and out of of band errors, it is not near perfect as we saw with PGGB upsampling.
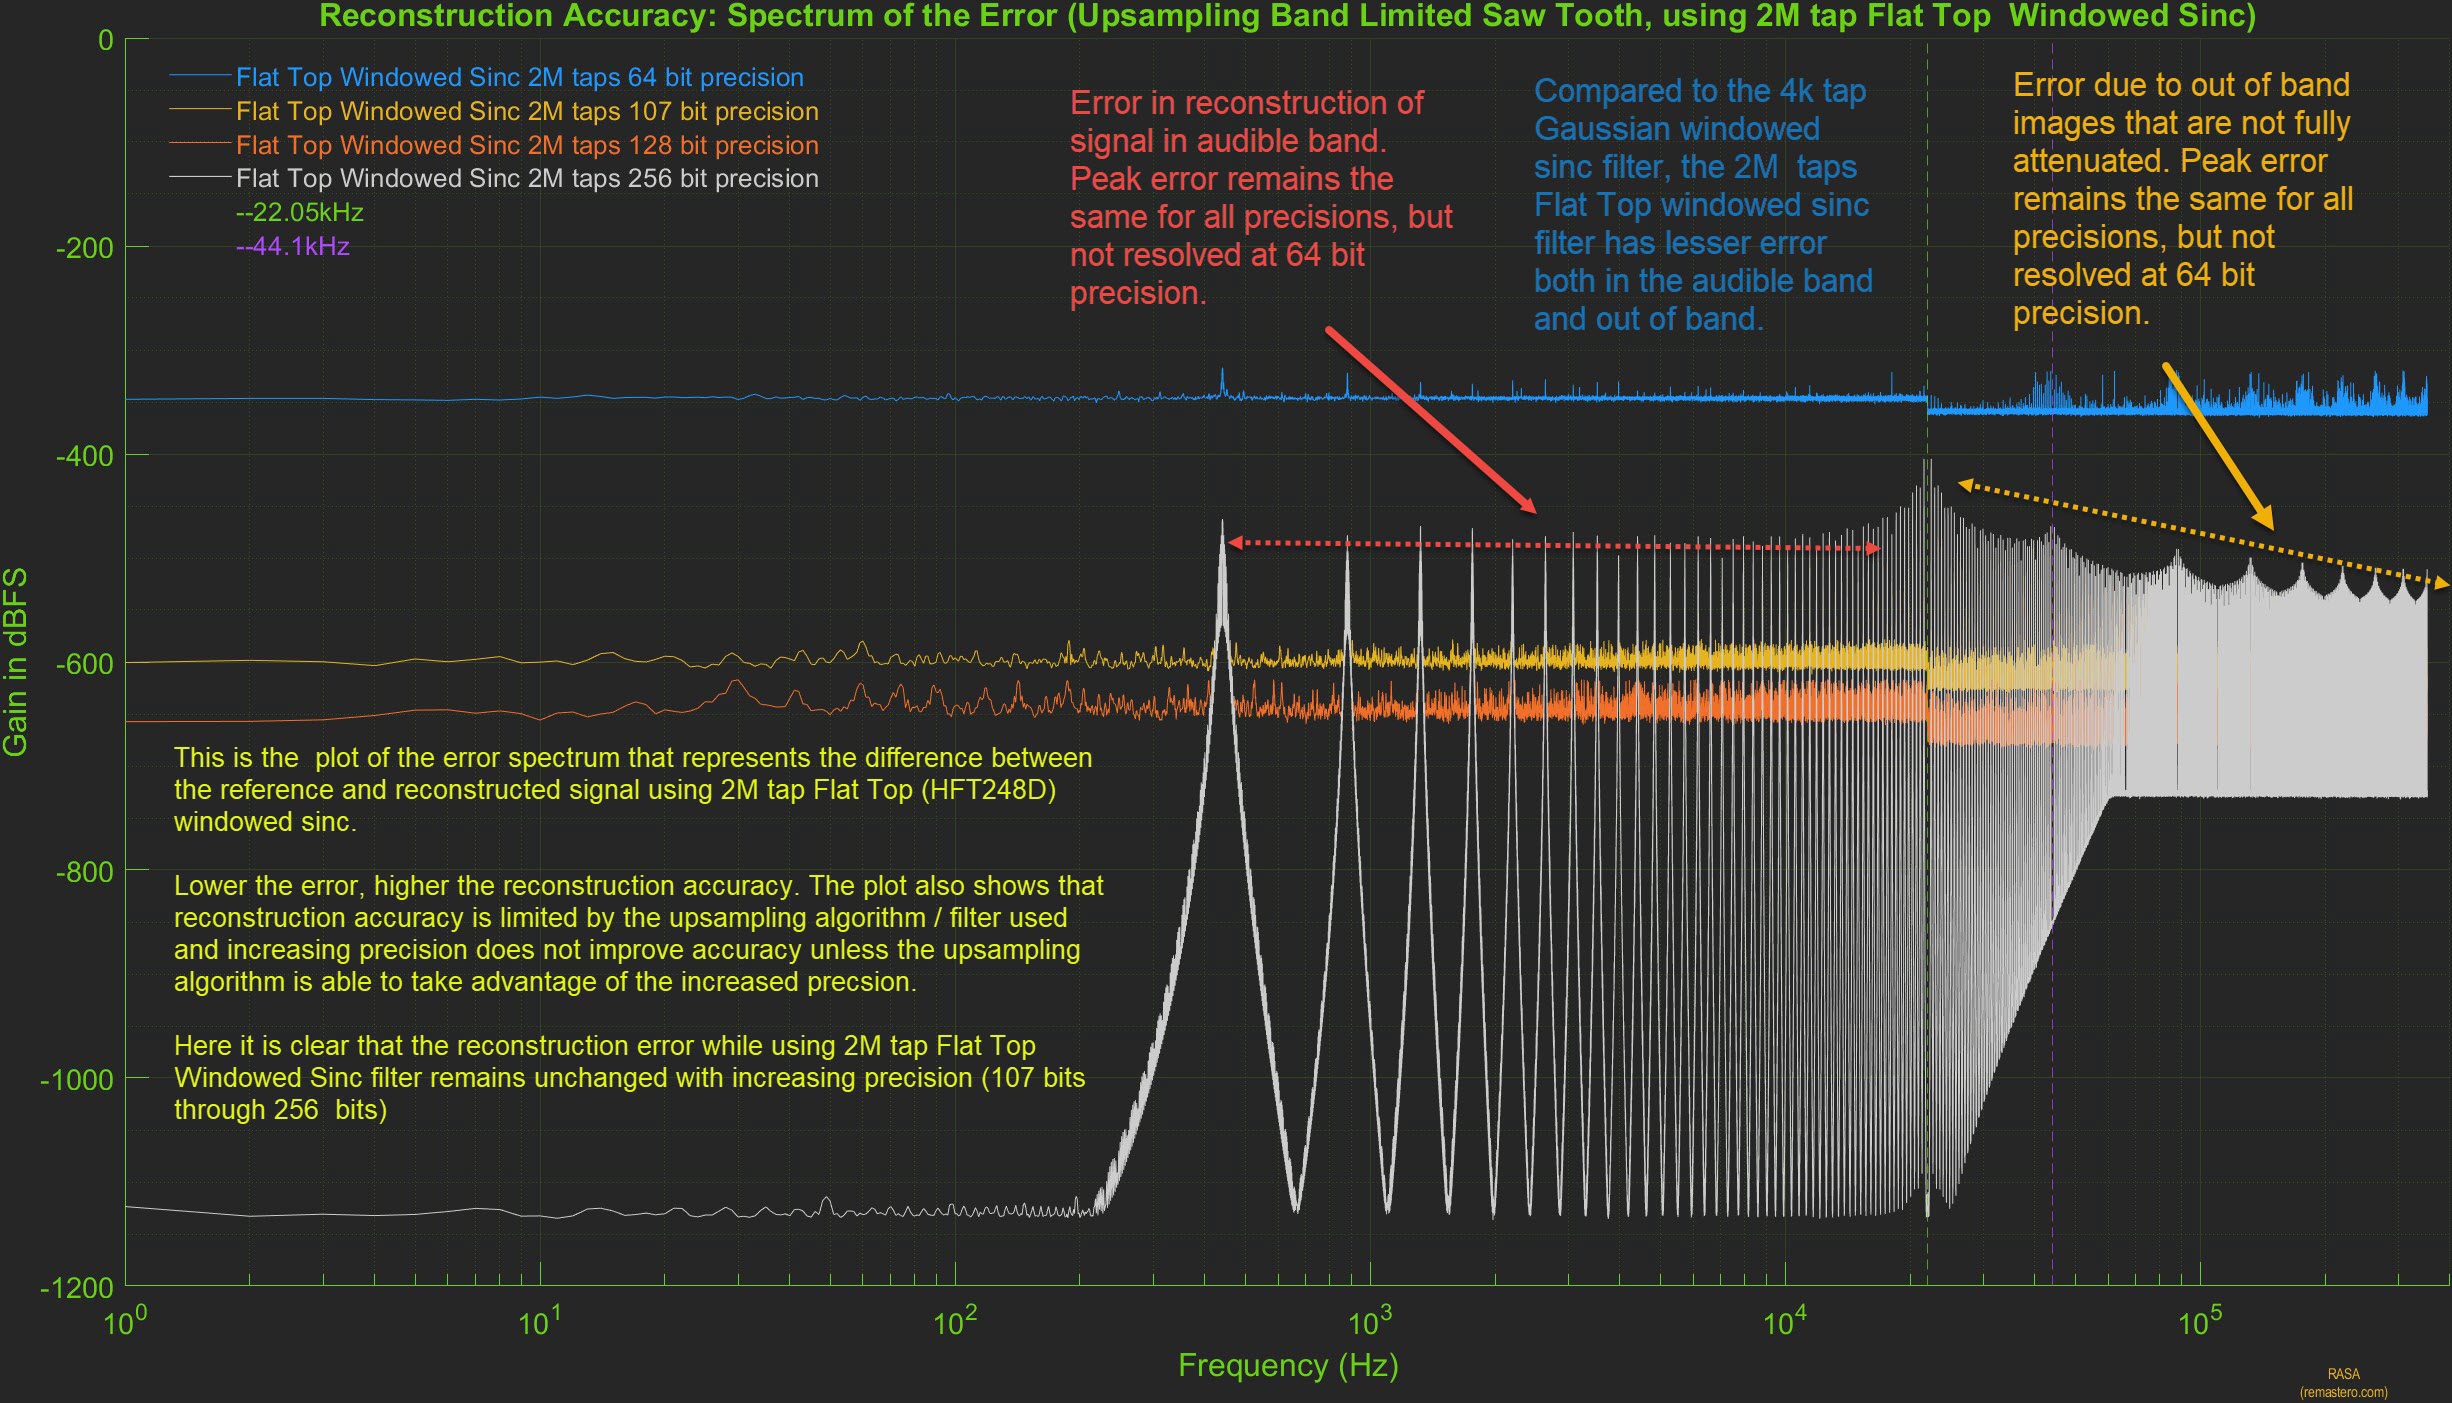
From the above plot, we clearly see that the reconstruction error remains unchanged with precision, increasing precision reduces the quantization noise floor but the peak error remains unchanged. In the case of the 2M sinc filter, it will be counter prodctive to use precisions higher than 75 - 80 bits.
-
Medium Non-Apodizing Optimized Filter (250k Optimized Windowed Sinc).
We showed previously that even though the long sinc filter with 2M taps did not provide near ideal reconstruction accuracy, it improved significantly over the shorter Gaussian filter. Though the longer sinc filter provided better reconstruction accuracy and better attenuation of out of band images, the filter was not designed with reconstruction accuracy in mind. One can do a lot better with even a shorter filter if the filter can retain more of the original sinc coefficients and at the same time, the window tapper is optimized to achieve better attenuation of out of band images. In fact, this was the approach in the windowed sinc functions used by earlier versions of PGGb (V3 and older). For this analysis, we chose a linear phase, medium length (250k tap) sinc filter, it is non apodizing with a corner frequency that matches the Nyquist frequency of 22.05khz, and we use our proprietary optimized window. We chose this filter to illustrate that a medium length filter can easily improve over a much longer filter if properly designed. Below are the results of upsampling the BLST signal to 705.6kHz using the medium non-apodizing filter using 107 bit precision. The time domain and frequency spectrum of the upsampled signal are shown below.
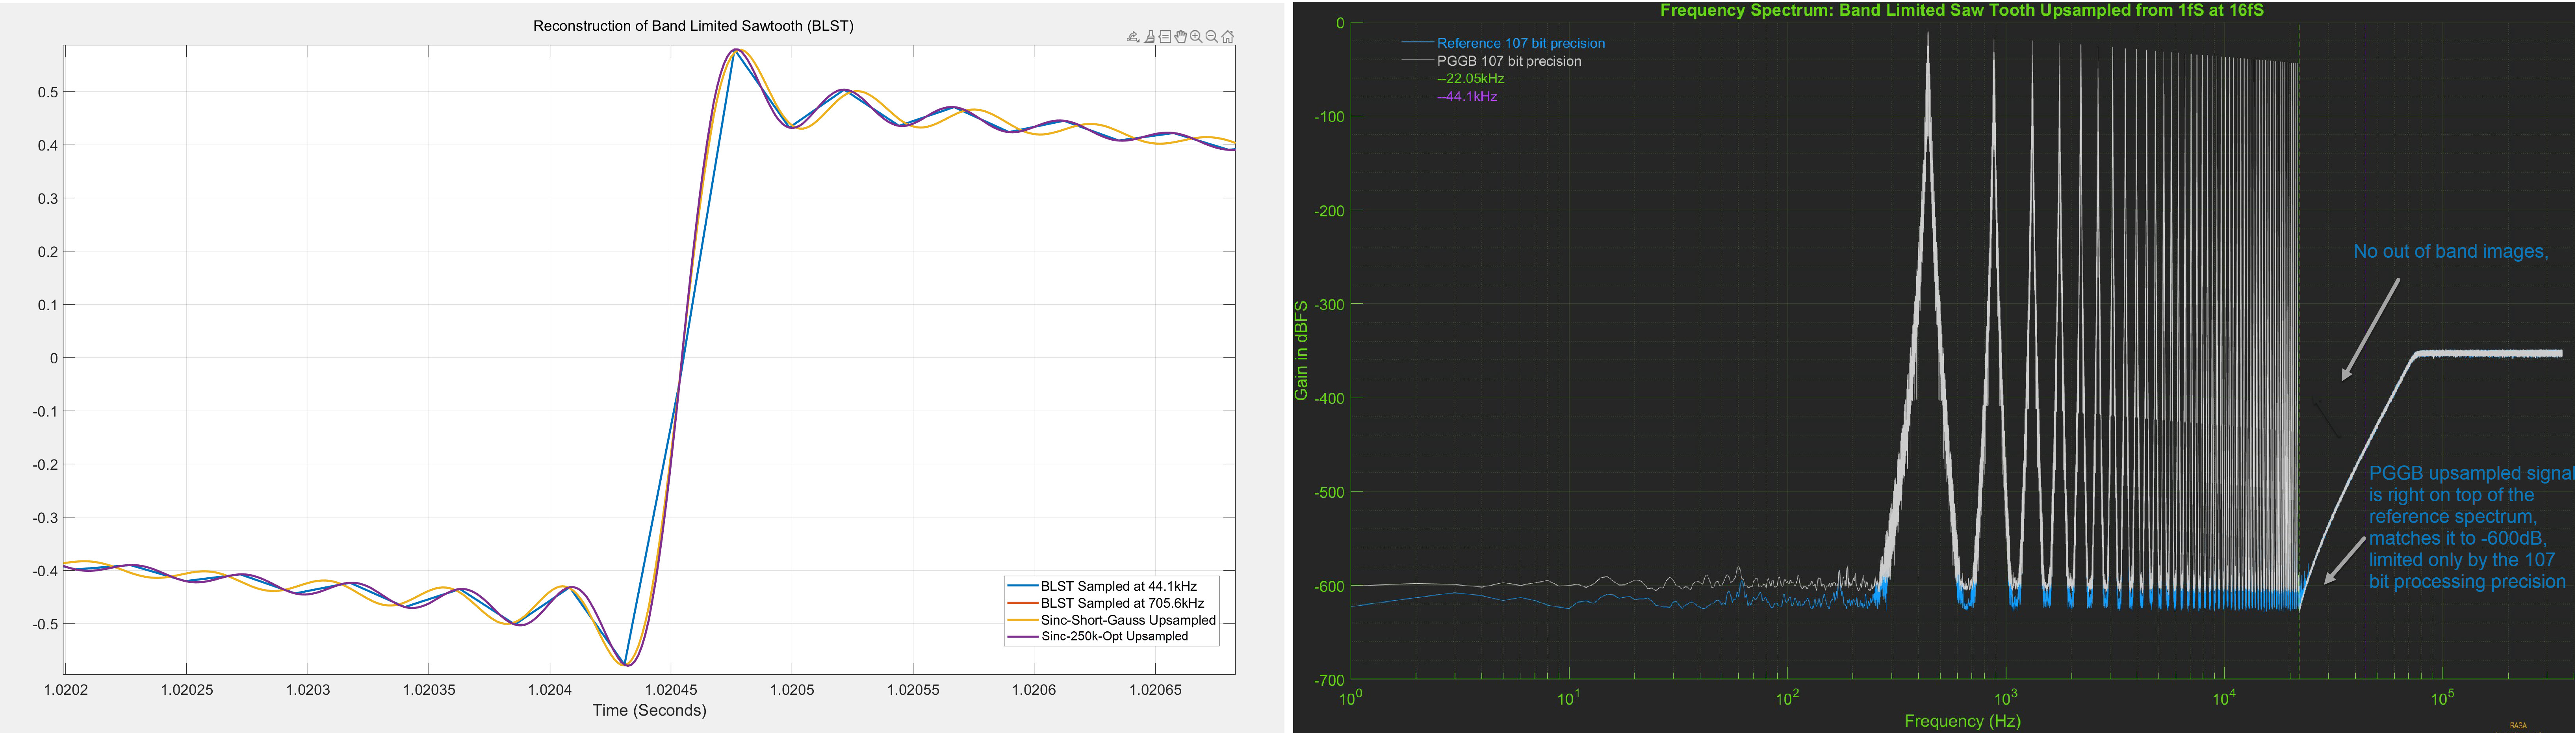
As before, the reference signal was directly generated at 107 bit precision at 705.6kHz. The plot on the left is the time domain plot, zoomed into one of the rising edges of the sawtooth signal. The 250k Sinc upsampled signal (purple) is right on top of the reference signal (red) and is indistinguishable. The plot on the right is the frequency spectrum of the 250k optimized sinc upsampled signal (grey) and the reference signal (blue). Here the spectrum of 250k sinc upsampled signal is right on top of the reference signal until the Nyquist frequency of 22.05khz, but unlike the longer 2M sinc filter, we do not see any out of band images, they are not fully attenuated up to the noise floor of 107 bit precision.
We further evaluate the reconstruction accuracy of the 250k optimized sinc filter by plotting the spectrum of error between the reference signal and 250k optimized sinc filter upsampled signal. Below is the plot of the spectrum of the error at all precisions. We do not see any errors at 64 bit, 107 bit and 128 bit precision, but we see some error near the Nyquist frequency at 256 bit precision we also see that at 256bit, the noise floor is higher than what we saw for PGGB upsampling.
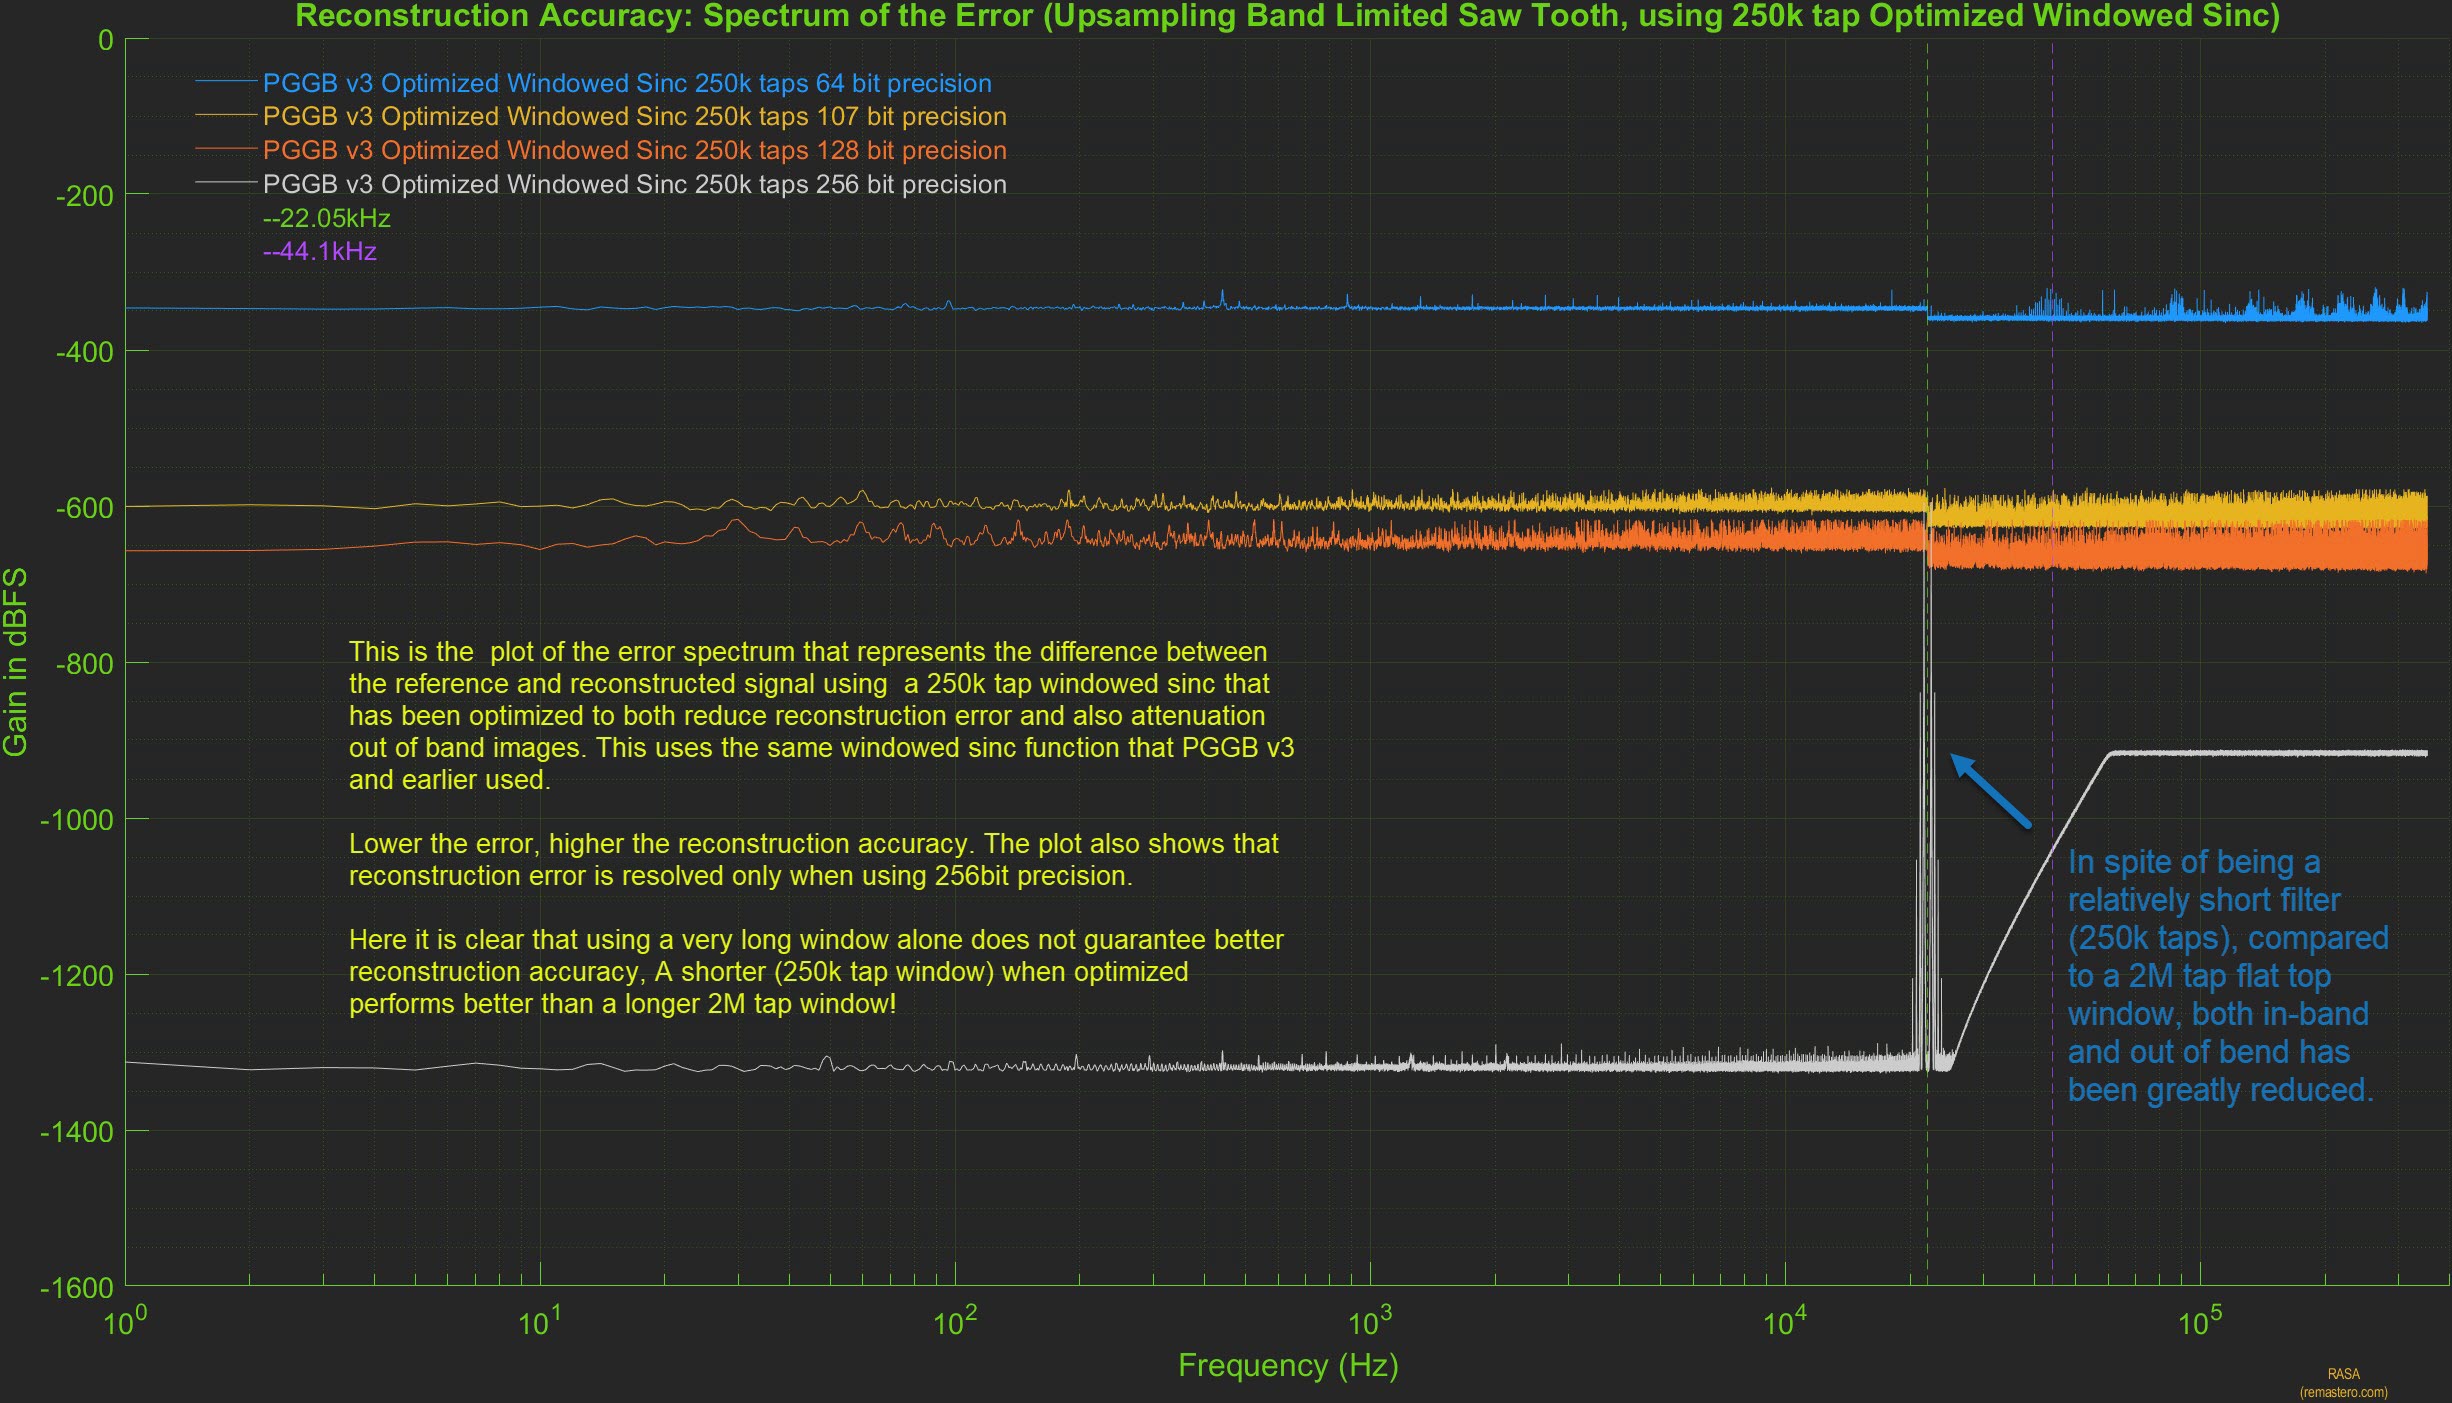
This shows that when properly designed with reconstruction accuracy in mind, a medium length filter can provide much better reconstruction accuracy, but it may still fall short of the near ideal reconstruction accuracy provided by PGGB which does not use a windowed sinc function.
The Takeaway.
We showed that reconstruction accuracy is affected by the type of upsampling algorithm used and that in-band reconstruction error exists even for a relatively simple periodic signal such as the sawtooth waveform. Increasing precision only helps if the upsampling algorithm is accurate and if noise shaping can be used. The PGGB upsampling algorithm provides near ideal reconstruction accuracy, limited only by the quantization noise floor for the precision used.